Seaborn
Seaborn
基本知识
概念
seaborn 是基于 matplotlib 的图形可视化 python 包。它提供了一种高度交互式界面,便于用户能够做出各种有吸引力的统计图表。
Seaborn 是在 matplotlib 的基础上进行了更高级的 API 封装,从而使得作图更加容易,在大多数情况下使用 seaborn 能做出很具有吸引力的图,而使用 matplotlib 就能制作具有更多特色的图。应该把 Seaborn 视为 matplotlib 的补充,而不是替代物。同时它能高度兼容 numpy 与 pandas 数据结构以及 scipy 与 statsmodels 等统计模式
| |
层级 API
Seaborn 中的 API 分为 Figure-level 和 Axes-level 两种
Axes-level 的函数可以实现与 Matplotlib 更灵活和紧密的结合,而 Figure-level 则更像是「懒人函数」,适合于快速应用
声明样式
| |
参数
- context
- 控制着默认的画幅大小,分别有
{paper, notebook, talk, poster}四个值。 - 其中,
poster > talk > notebook > paper。
- 控制着默认的画幅大小,分别有
- style
- 控制默认样式,分别有
{darkgrid, whitegrid, dark, white, ticks}
- 控制默认样式,分别有
- palette
- 预设的调色板。分别有
{deep, muted, bright, pastel, dark, colorblind}等
- 预设的调色板。分别有
- font
- 用于设置字体
- font_scale :设置字体大小
- color_codes: 不使用调色板而采用先前的
'r'等色彩缩写。
默认参数
| |
通用参数
sns.图名(x=‘X轴 列名’, y=‘Y轴 列名’, data=原始数据df对象)
sns.图名(x=np.array, y=np.array[, …])
数据必须以长格式的 DataFrame 传入,同时变量通过 x, y 及其他参数指定。
- x, y:data 中的变量名
- data:长格式的 DataFrame,每列是一个变量,每行是一个观察值。
- hue: data 中的名称,可选
- 将会产生具有不同颜色的元素的变量进行分组
- palette:色盘名,列表,或者字典,可选
- 用于 hue 变量的不同级别的颜色
- size:data 中的名称,可选
- 将会产生具有不同尺寸的元素的变量进行分组
- style:data中的名称,可选
- 将会产生具有不同风格的元素的变量进行分组
- row, col:data 中的变量名,可选
- 确定网格的分面的类别变量
- col_wrap:int,可选
- 以此宽度“包裹”列变量,以便列分面跨越多行。与 row 分面不兼容
- color:控制颜色
- bins:条形图的条数
- palette:颜色列表
保存
| |
关联图
(Relational plots)
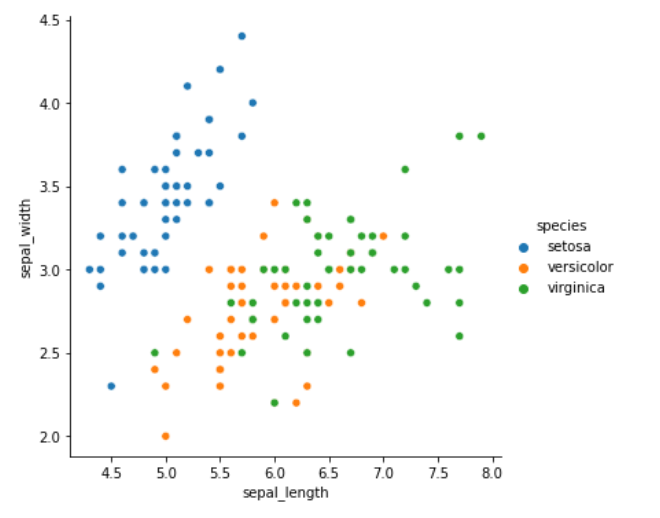
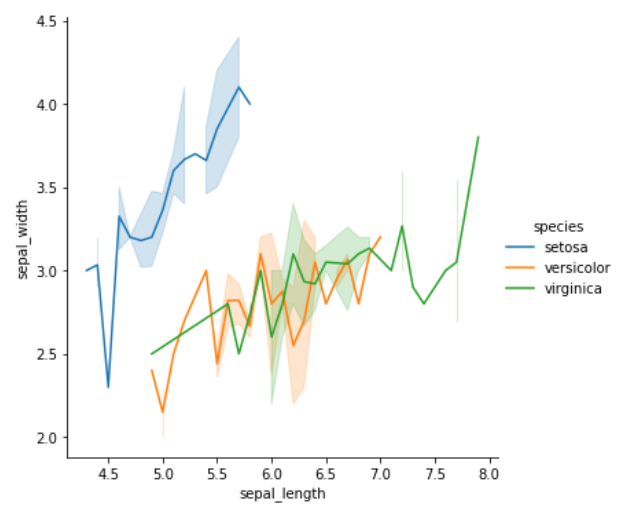
关联图用于呈现数据之间的关系,主要有散点图和条形图 2 种样式
两个连续型变量之间的关系
| 关联性分析 | 介绍 |
|---|---|
| relplot | 绘制关系图 |
| scatterplot | 多维度分析散点图 |
| lineplot | 多维度分析线形图 |
函数
| |
kind 参数选择要使用的基础轴级函数:
- 散点图
- scatterplot():通过
kind="scatter"访问;默认为此
- scatterplot():通过
- 折线图
- lineplot():通过
kind="line"访问
- lineplot():通过
例
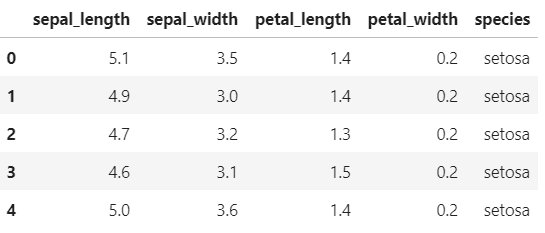
以鸢尾花数据集为例
| |
类别图
(categorical plots)
类别图呈现单个数据与类别之间的关系
针对一个离散型变量与一个连续型变量之间的关系
函数
| |
类别图的 Figure-level 接口是 catplot。而 catplot 实际上是如下 Axes-level 绘图 API 的集合:
- 分类散点图
- stripplot():(
kind="strip") - swarmplot():(
kind="swarm")
- stripplot():(
- 分类分布图
- boxplot():(
kind="box") - boxenplot():(
kind="boxen") - violinplot() (
kind="violin")
- boxplot():(
- 分类估计图
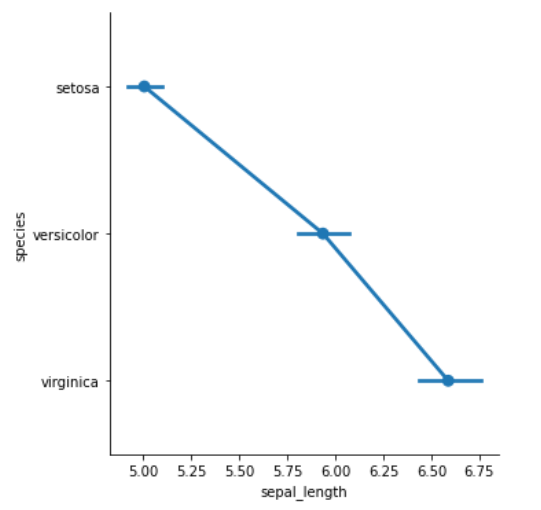
- pointplot(): (
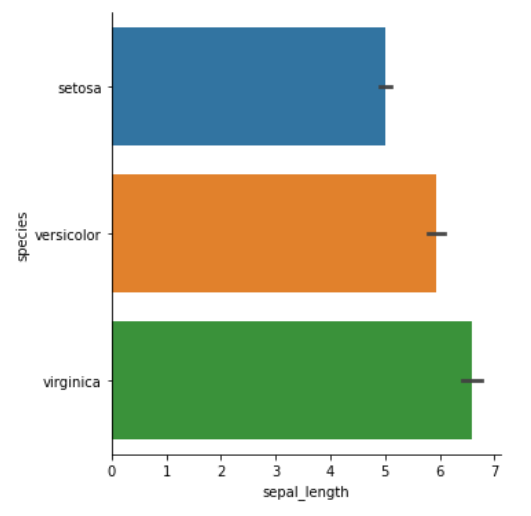
kind="point") - barplot():(
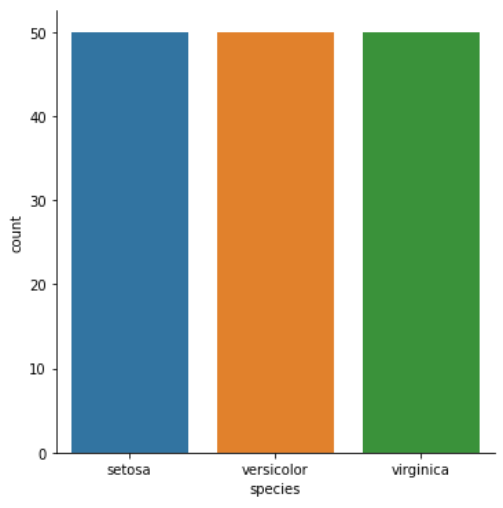
kind="bar") - countplot():(
kind="count")
- pointplot(): (
参数说明
hue=参数可以给图像引入另一个维度。如果一个数据集有多个类别,hue=参数就可以让数据点有更好的区分- 计数条形图只传入一个分类参数
- jitter:表示抖动的程度(仅沿类別轴)。当很多数据点重叠时,可以指定抖动的数量或者设为 True 使用默认值。
例
散点图
| |
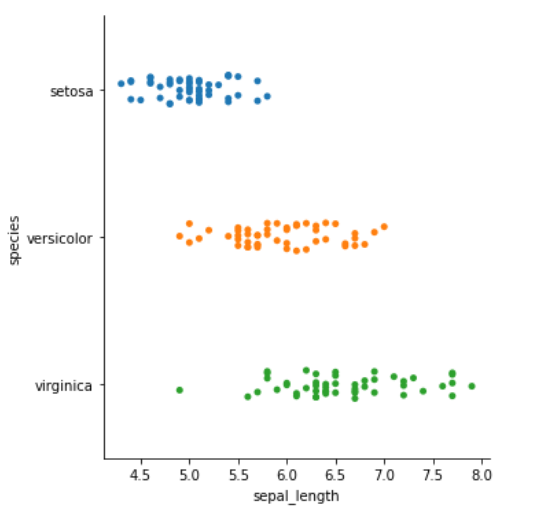
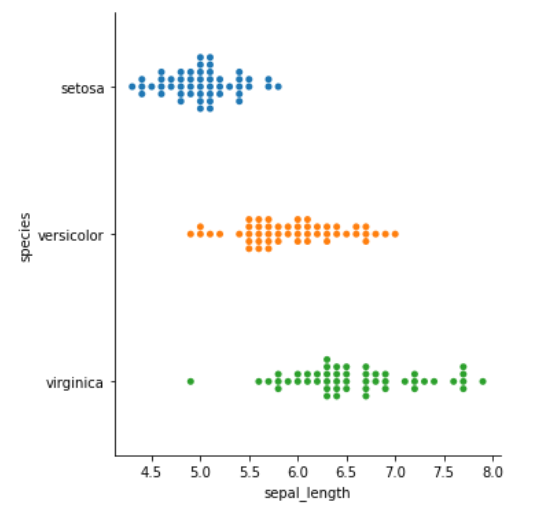
kind="swarm" 可以让散点按照 beeswarm 的方式防止重叠,可以更好地观测数据分布
| |
分布图
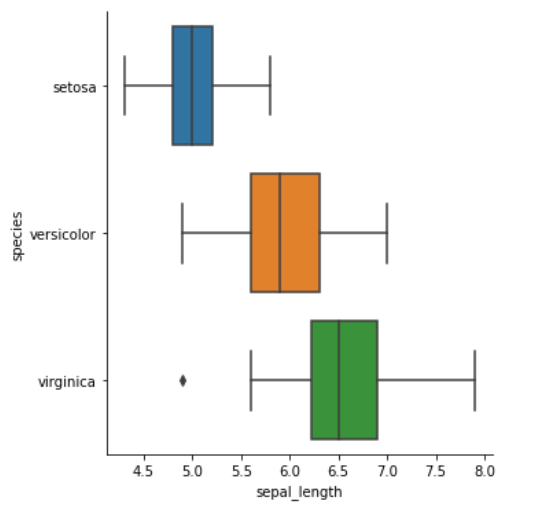
箱线图
| |
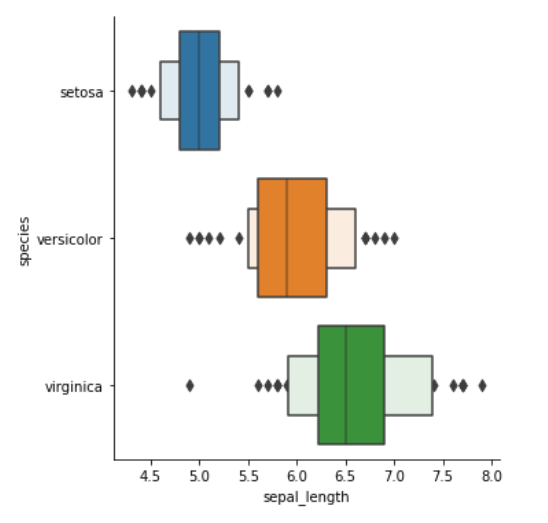
增强箱线图
| |
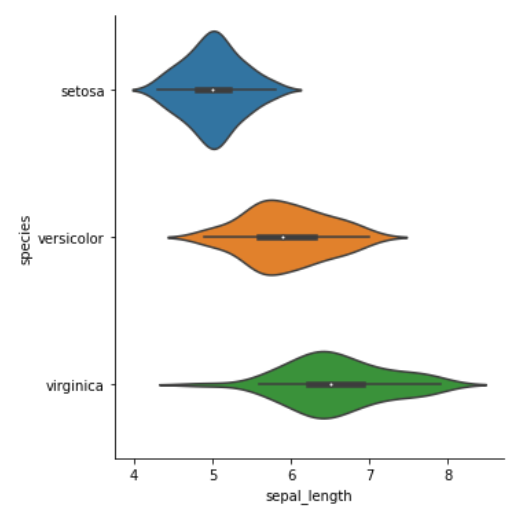
小提琴图
| |
估计图
点线图
| |
条形图
| |
计数条形图
只传入一个分类参数
| |
分布图
(Distribution plots)
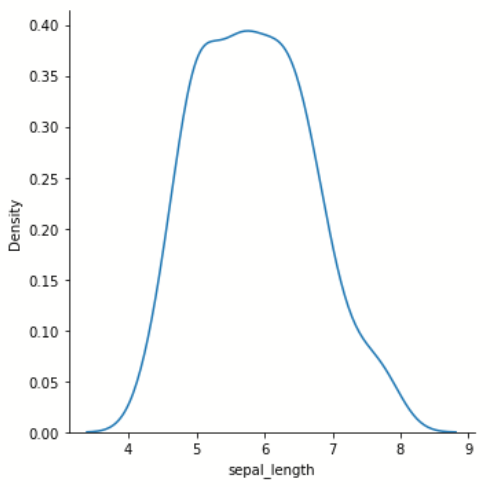
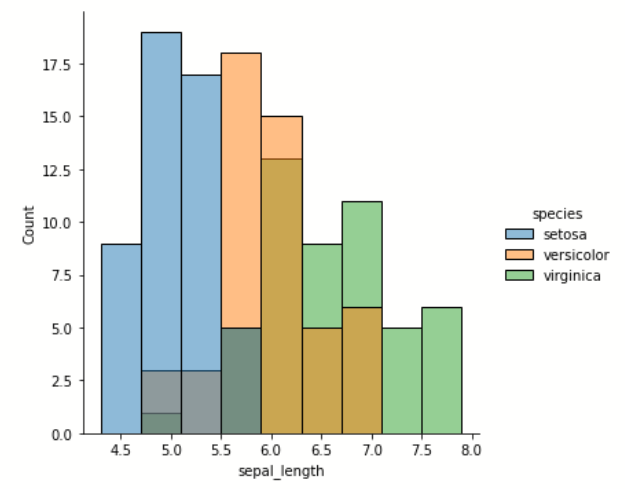
分布图主要是用于可视化变量的分布情况,一般分为单变量分布和多变量分布。当然这里的多变量多指二元变量,更多的变量无法绘制出直观的可视化图形
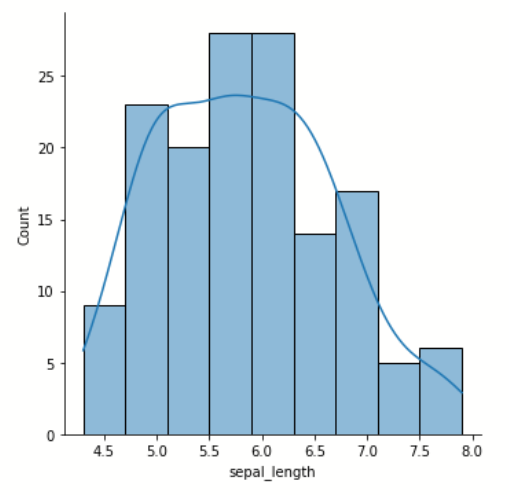
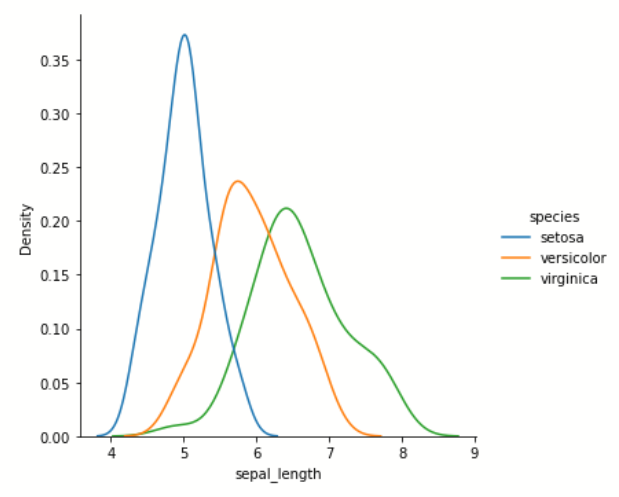
displot() 单变量分布
| |
该方法将会绘制直方图,拟合核密度估计图,或二者兼有
该方法主要做单变量分布,但同样可以传入 y 参数
可以引入 hue 进行分类
- 直方图
- histplot():通过
kind='hist'访问
- histplot():通过
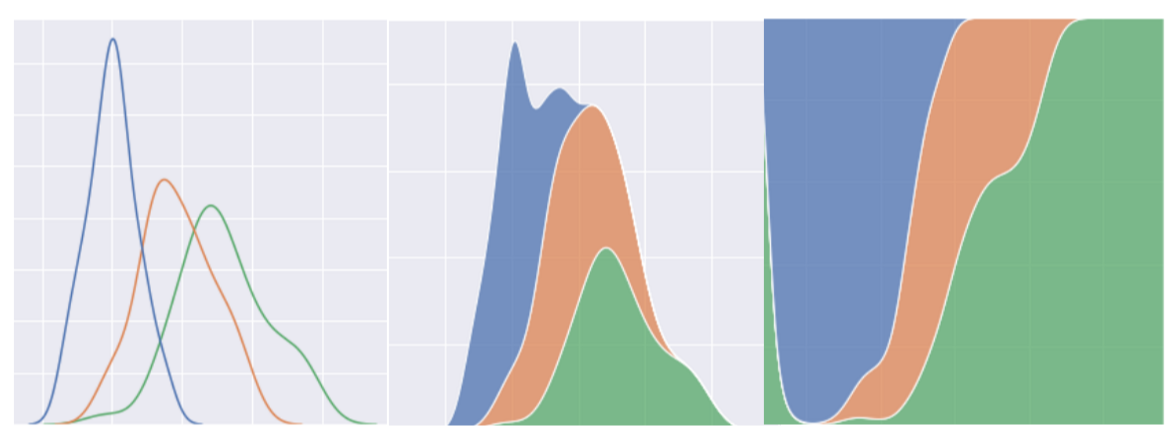
- 核密度估计图
- kdeplot():通过
kind='kde'访问
- kdeplot():通过
参数说明
bins:用于控制条形的数量。
kdeplot 中:
- multiple:{“layer”, “stack”, “fill”}
- Method for drawing multiple elements when semantic mapping creates subsets. Only relevant with univariate data
例
| |
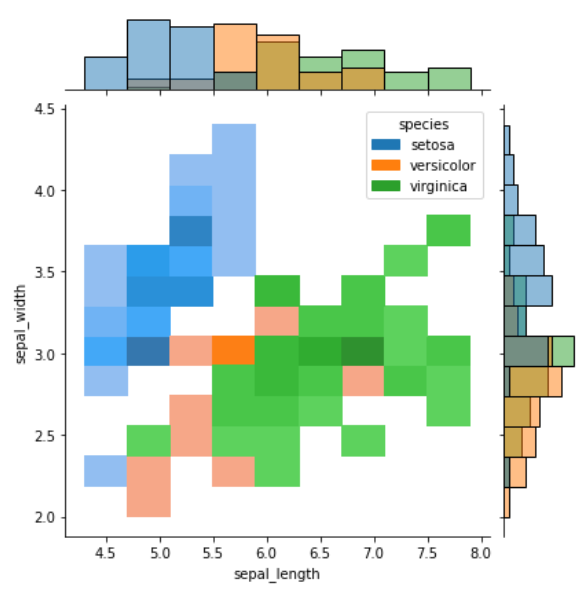
jointplot() 双变量分布
| |
该方法绘制二元变量之间的关系,它并不是一个 Figure-level 接口,但其支持 kind= 参数指定绘制出不同样式的分布图,默认为 scatter
- kind:{‘scatter’, ‘kde’, ‘hist’, ‘reg’,’hex’}
例
| |
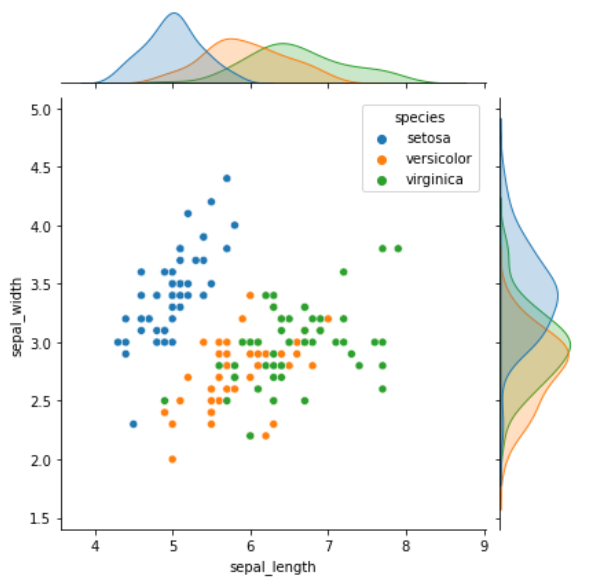
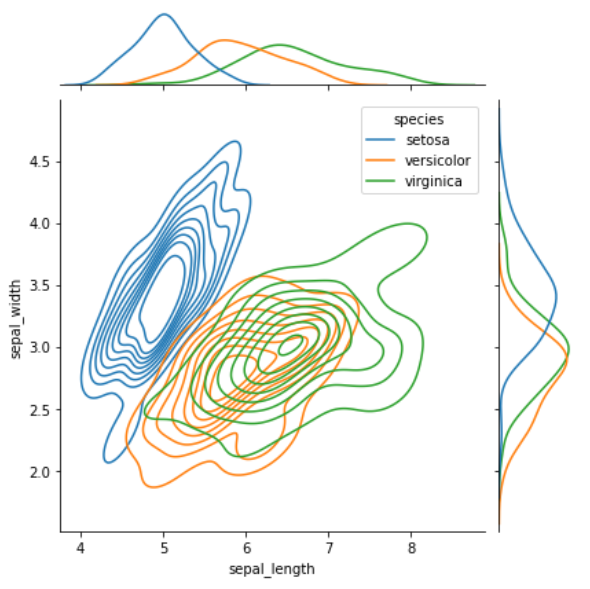
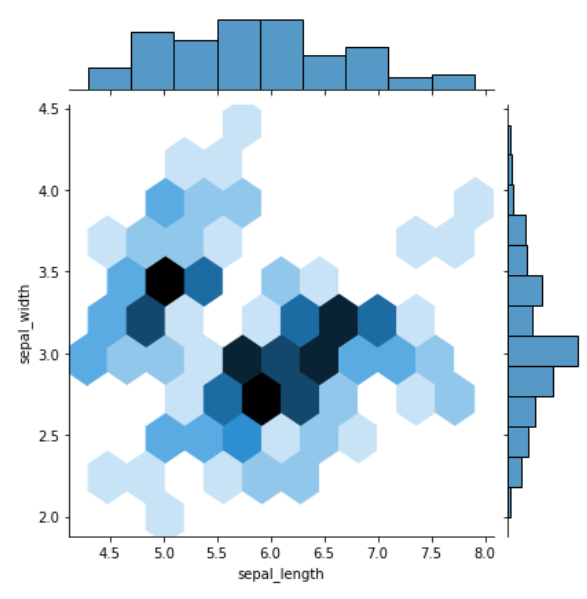
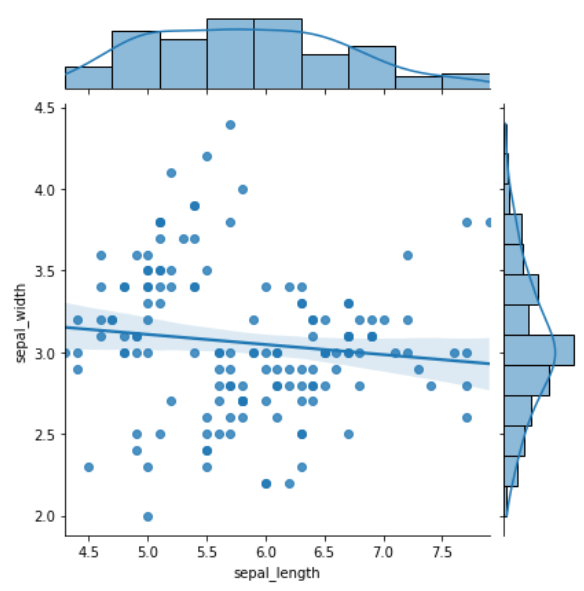
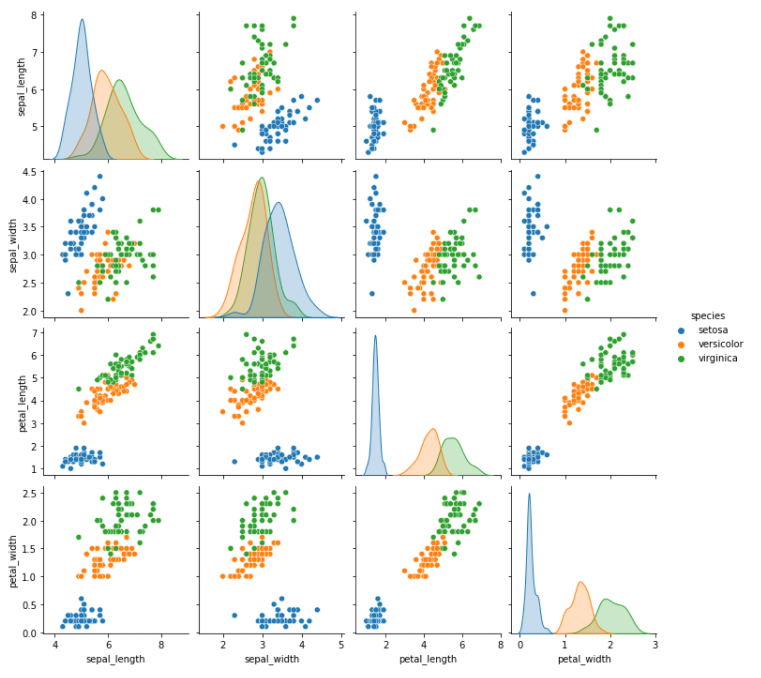
pairplot() 两两对比分布
| |
该方法支持一次性将数据集中的特征变量两两对比绘图。默认情况下,对角线上是单变量分布图,而其他则是二元变量分布图
例
| |
回归图
(Regression plots)
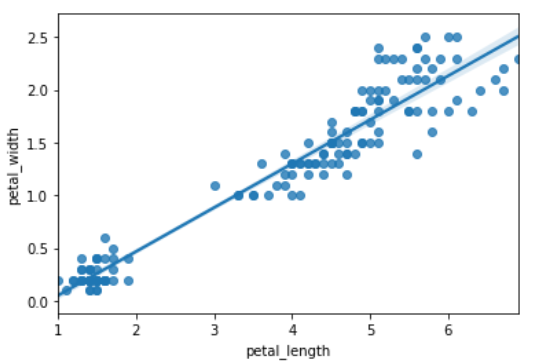
regplot 线性回归
| |
使用该方法绘制回归图时,只需要指定自变量和因变量即可,它会自动完成线性回归拟合
无hue参数
例
| |
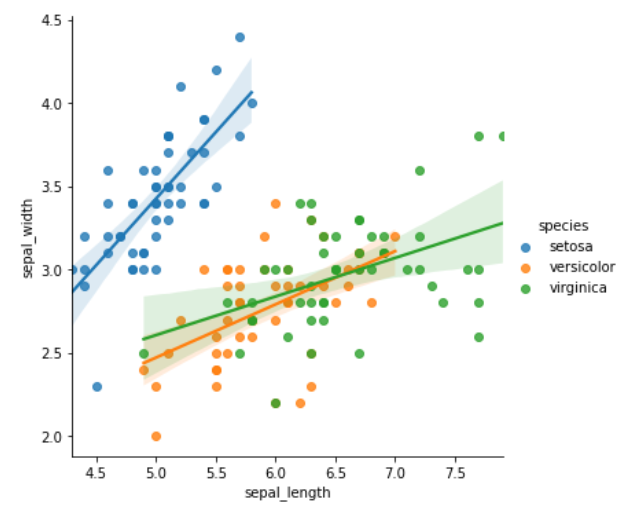
lmplot 分类回归
| |
该方法支持引入第三维度进行对比,也就是可以用hue参数
例
| |
矩阵图
(Matrix plots)
heatmap() 热力图
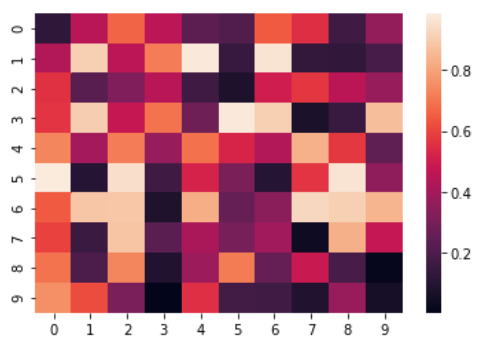
| |
必须传入二维数组类型的 data
例
| |
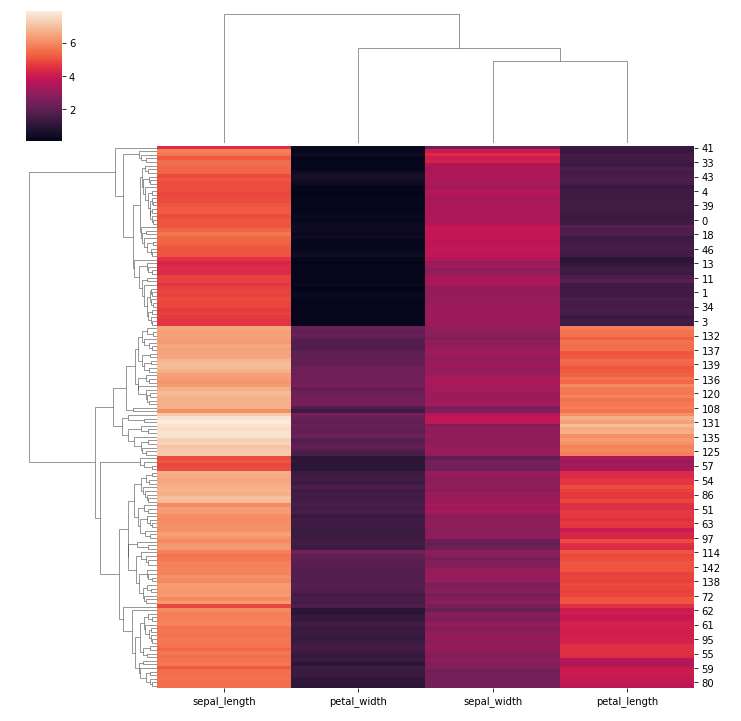
clustermap() 分层聚类热图
| |
data:2D array-like
例
| |
技巧
- 设置颜色
| |