matplotlib

matplotlib
https://trou.oss-cn-shanghai.aliyuncs.com/img/20200311093420888.png

 1
 2
 3
 4
 5
 6
 7
 8
 9
10
11
12
13
14
15
16
from birthday import get_p
import matplotlib.pyplot as plt
import seaborn as sns
sns.set()

m = 2000
n = [i for i in range(100)]
q = [get_p(m, i) for i in n]

plt.plot(n, q)
plt.xlabel("student number")
plt.ylabel("probability")
plt.legend()

plt.savefig(fname='pic.png')
plt.show()

创建图片与子图

若不创建实例,一切对象名均使用plt!

导入

1
import matplotlib.pyplot as plt

层次

  • Figure:面板(图),matplotlib 中的所有图像都是位于 figure 对象中,一个图像只能有一个 figure 对象。

  • Subplot:子图,figure 对象下创建一个或多个 subplot 对象(即 axes)用于绘制图像。

创建图片

1
fig = plt.figure()

plt.figure()返回 figure 实例

一个空白的绘图窗口就会出现

重要参数

  • num:新图的编号,默认递增

  • figsize:宽度,高度,以英寸为单位

  • dpi:分辨率,整数

  • facecolor:背景颜色

  • edgecolor:边框颜色

  • frameon:若为 False,则没有边框

  • clear:若为 True,如果图的编号已存在则先清除

创建子图

.add_subplot()

1
2
3
4
5
ax1 = fig.add_subplot(2, 2, 1)
#将fig分割成2行3列,画出并返回序号1的子图
ax2 = fig.add_subplot(2, 2, 2)
ax3 = fig.add_subplot(2, 2, 3)
#注意,此时fig上只有3张子图,其他子图没有被初始化

fig.add_subplot(nrows, ncols, index)以图片作为对象,返回 Axes 实例

你可以直接在其他空白的子图上调用 Axes 对象的实例方法进行绘图
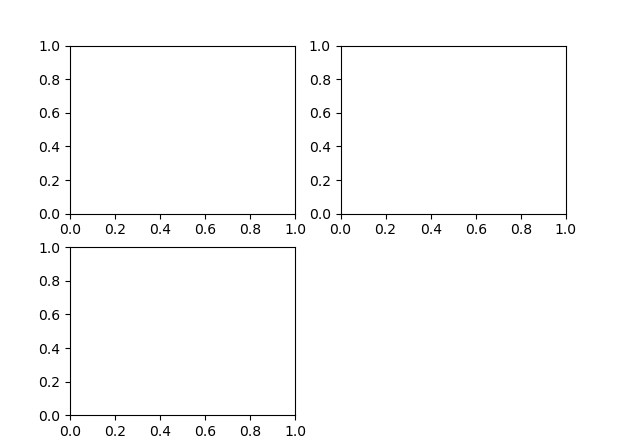
image-20201221134419683

plt.subplots()

使用子图网格创建图片是非常常见的任务,所以 matplotlib 包含了一个便捷方法 plt.subplots,它创建一个新的图片,然后返回包含了已生成子图对象的 NumPy 数组:

1
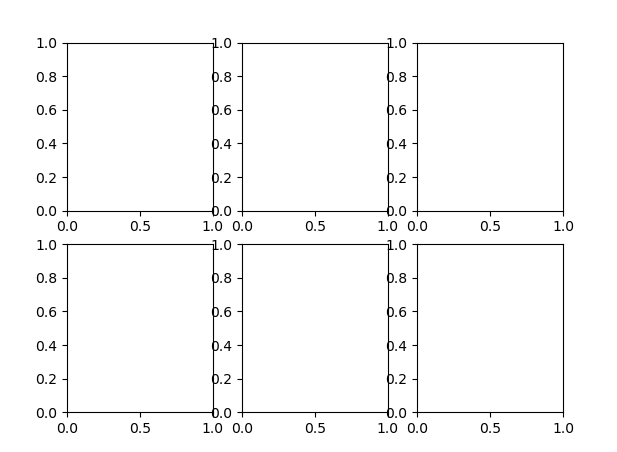
fig, axes = plt.subplots(2, 3)
image-20201221140159363
API
1
plt.subplots(nrows=1, ncols=1, sharex=False, sharey=False, squeeze=True, subplot_kw=None, gridspec_kw=None, **fig_kw)

返回 figure 实例和子图数组

参数
  • nrows,ncols:子图的行列数
  • sharex, sharey
    • 设置为 True 或者 ‘all’ 时,所有子图共享 x 轴或者 y 轴,
    • 设置为 False or ‘none’ 时,所有子图的 x,y 轴均为独立,
    • 设置为 ‘row’ 时,每一行的子图会共享 x 或者 y 轴,
    • 设置为 ‘col’ 时,每一列的子图会共享 x 或者 y 轴。
  • squeeze:设置返回的子图对象的数组格式。
    • 当为 False 时,不论返回的子图是只有一个还是只有一行,都会用二维数组格式返回他的对象。
    • 当为 True 时,如果子图只有一个,则返回的子图对象是标量形式,如果子图有(N×1)或(1×N)个,则返回的子图对象是一维数组,如果是(N×M)则返回二维数组。
  • subplot_kw:字典格式,传递给 add_subplot(),用于创建子图
  • gridspec_kw:字典格式,传递给GridSpec的构造函数,用于创建子图所摆放的网格。
  • **fig_kw :所有其他关键字参数都传递给 figure()调用。
格式
 1
 2
 3
 4
 5
 6
 7
 8
 9
10
11
#单行单列,按照一维数组来表示
ax = fig.subplots(2,1)    	# 2*1
ax[0].plot([1,2], [3,4])	# 第一个图
ax[1].plot([1,2], [3,4])	# 第二个图

#多行多列,按照二维数组来表示
ax = fig.subplots(2,2)    	# 2*2
ax[0,1].plot([1,2], [3,4])	# 第一个图
ax[0,1].plot([1,2], [3,4])	# 第二个图
ax[1,0].plot([1,2], [3,4])	# 第三个图
ax[1,1].plot([1,2], [3,4])	# 第四个图

数组 axes 可以像二维数组那样方便地进行索引,例如,axes[0,1]

调整子图周围的间距

默认情况下,matplotlib 会在子图的外部和子图之间留出一定的间距。这个间距都是相对于图的高度和宽度来指定的,所以如果你通过编程或手动使用 GUI 窗口来调整图的大小,那么图就会自动调整。

可以使用图对象上的plt.subplots_adjust方法更改间距

1
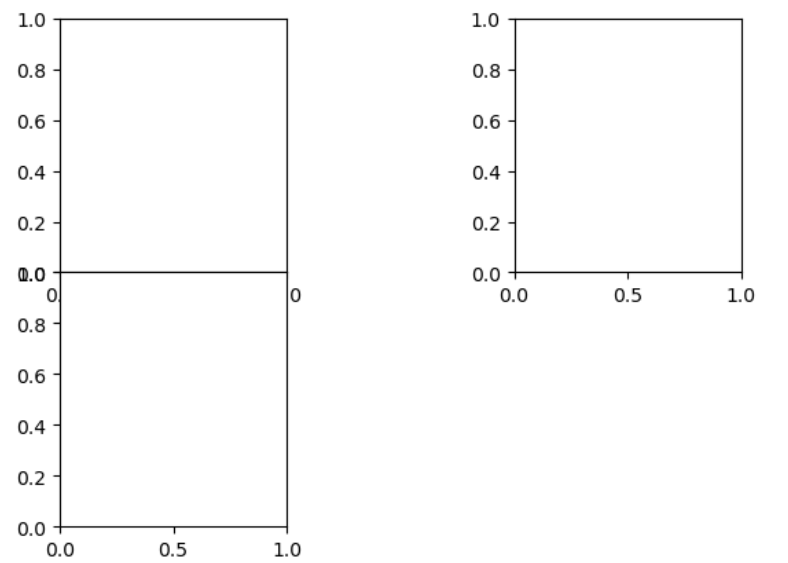
plt.subplots_adjust(wspace=1,hspace=0)
image-20201221141911201
API
1
plt.subplots_adjust(left=None, bottom=None, right=None, top=None, wspace=None, hspace=None)
参数
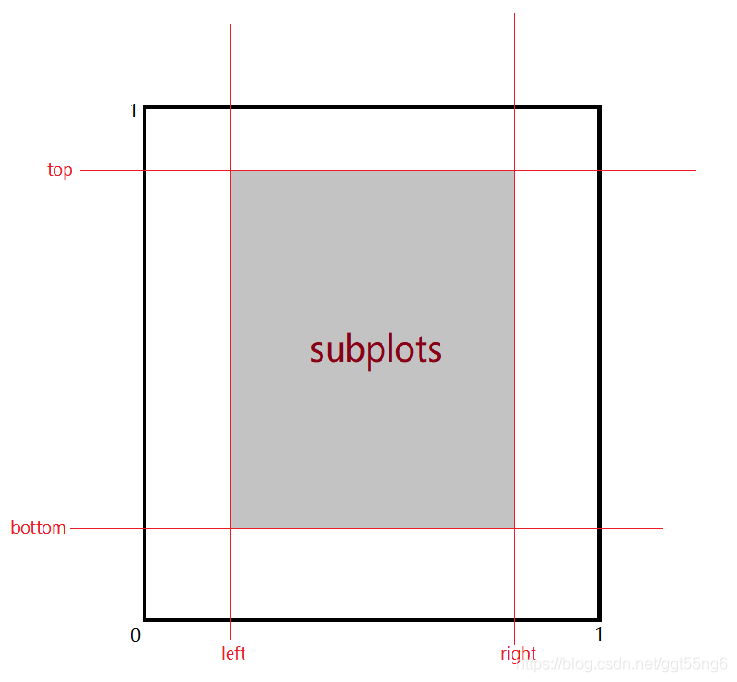
  • left, right, bottom, top:子图所在区域的边界
    • 当值大于 1.0 的时候子图会超出 figure 的边界从而显示不全;值不大于 1.0 的时候,子图会自动分布在一个矩形区域
    • 要保证 left < right, bottom < top,否则会报错
left, right, top, bottom
  • wspace, hspace:子图之间的横向间距、纵向间距分别与子图平均宽度、平均高度的比值,也就是图片的宽度和高度百分比

修饰

设置标题

设置图片标题

1
plt.suptitle('The Title',fontsize=14,color='purple')

若要直接在 figure 上操作

1
2
3
plt.title('The Title',fontsize=14,color='purple')
#传figure的名字最好
fig.title('The Title',fontsize=14,color='purple')
常用参数
  • fontsize:设置字体大小,默认 12,
    • ['xx-small', 'x-small', 'small', ‘medium’, ‘large’, ’x-large’, ‘xx-large’]
  • fontweight:设置字体粗细
    • [‘light’, ‘normal’, ‘medium’, ‘semibold’, ‘bold’, ‘heavy’, ‘black’]
  • fontstyle:设置字体类型
    • [ ‘normal’, ‘italic’, ‘oblique’ ];italic 斜体,oblique 倾斜
  • color:设置字体颜色
  • verticalalignment:设置水平对齐方式
    • [ ‘center’ , ‘top’ , ‘bottom’ ,’baseline’]
  • horizontalalignment:设置垂直对齐方式
    • ['left', 'right', 'center']
  • rotation:旋转角度
    • [‘vertical’, ‘horizontal’] 也可以为数字
  • alpha:透明度,参数值 0 至 1 之间
  • backgroundcolor:标题背景颜色
  • bbox:给标题增加外框
    • ‘boxstyle’ :方框外形
    • ‘facecolor’ :(简写 fc)背景颜色
    • ‘edgecolor’ :(简写 ec)边框线条颜色
    • ‘edgewidth’ :边框线条大小

设置子图标题

1
ax1.set_title('graph1')

用 Axe 对象接受此函数

参数见 2.1.1

轴操作

set 方法允许批量设置绘图属性,如

1
2
3
4
5
props = {
    'title': 'My first matplotlib plot',
    'xlabel': 'Stages'
}
ax1.set(**props)

改变轴刻度

1
2
ax1.set_xticks([0,25,50,75,100])
ax1.set_yticks([10,20,30,40,50])

若要直接在figure上操作

1
2
plt.xticks([0,25,50,75,100])
plt.yticks([10,20,30,40,50])

添加轴标签

添加与刻度对应的标签

1
2
ax1.set_xticklabels(['one','two','three','four','five'])
ax1.set_yticklabels(['a','b','c','d','e'])

添加单一轴标签

1
ax1.set_xlabel('stage')

参数见 2.1.1

若要直接在figure上操作

1
2
3
4
5
plt.yticks([-2,-1.8,-1,1.22,3],['really bad','bad','normal','good','really ',
                                'good'])
#或
plt.xlabel('x-year',fontsize=14)
plt.ylabel('y-income',fontsize=14)

设置显示范围

1
plt.xlim(xmin, xmax)

xmin:x 轴上的最小值

xmax:x 轴上的最大值

y 轴亦如是

1
2
ax.get_lim()
ax.set_lim()

添加图例

.lengend()自动接受图像的label值,(label值在画图时传入)

1
ax1.legend(loc=4)
常用参数
  • loc:设置图列位置,数字代表在第几象限
    • ['best','upper right','upper left', 'lower left','lower right', 'right', 'center left', 'center right', 'lower center','upper center','center']
  • fontsize:设置图例字体大小
    • int or float or {‘xx-small’, ‘x-small’, ‘small’, ‘medium’, ‘large’, ‘x-large’, ‘xx-large’}
  • 设置图例边框及背景
    • frameon=False:去掉图例边框
    • edgecolor='blue':设置图例边框颜色
    • facecolor='blue':设置图例背景颜色,若无边框,参数无效
  • title:设置图例标题
  • markerfirst:如果为 True(默认),则图例标记位于图例标签的左侧
  • ncol:设置图例分为 n 列展示

若要直接在 figure 上操作

1
plt.legend()

添加注释

.text()

1
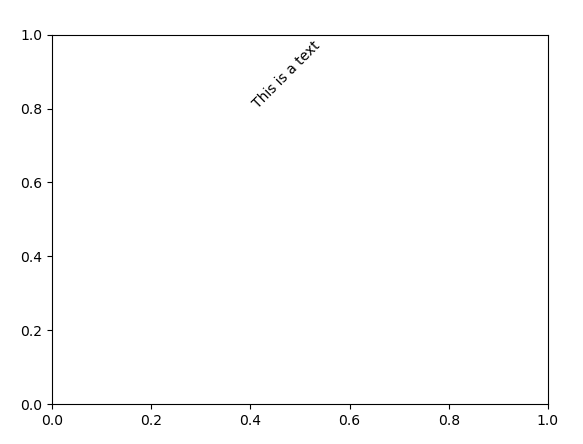
plt.text(0.4,0.8,"This is a text",rotation=45)
image-20201221171946301

API

1
.text(x,y,string,fontsize=15,verticalalignment=top,horizontalalignment=right)

参数

  • x,y:设置坐标值值
  • string:设置说明文字
  • 其余详见 2.1.1

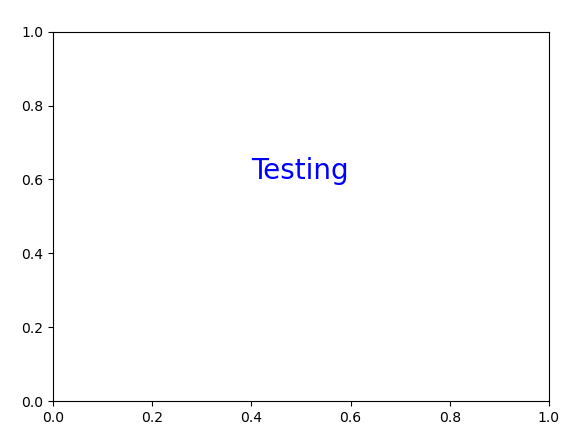
.annotate()

1
plt.annotate('Testing',xy=(0.4,0.6),fontsize=20,color='b')
image-20201221172233791

API

1
.annotate(string, xy=(x,y) ,xytext=(l1,l2) , )

参数

  • string:设置注释文本内容
  • xy:设置被注释的坐标点
  • xytext:设置注释文字的坐标位置

添加网格

1
plt.grid(linestyle="--", alpha=0.5)

绘制参考线

1
2
plt.axhline(y, c, ls, lw) 	#绘制平行于x轴的水平参考线
plt.axvline(x, c, ls, lw)  	#绘制平行于y轴的垂直参考线

y或x:水平参考线的出发点

c:参考线的线条颜色

ls:参考线的线条风格

lw:参考线的线条宽度

其他坐标轴设置

1
.axis()

参数

  • ‘equal’:x,y 轴刻度等长
  • ‘off’:关闭坐标轴
  • [a, b, c, d]:设置 x 轴的范围为[a, b],y 轴的范围为[c, d]

绘图

点图,线图

1
.plot(x,y)

API

1
2
3
4
#单条线:
plot([x], y, [fmt], data=None, **kwargs)
#多条线一起画
plot([x], y, [fmt], [x2], y2, [fmt2], ..., **kwargs)

参数

  • x,y:数据,x 可选

  • fmt:定义基本属性

  • fmt = '[color][marker][line]'

  • **kwargs

    • label

    • linestyle (ls)

      • {''-', '--', '-.', ':', ' '}
    • linewidth (lw):线宽

    • color

      • 可以用缩写、RGB、灰度字符串
      charactercolor
      ‘b’blue
      ‘g’green
      ‘r’red
      ‘c’cyan
      ‘m’magenta
      ‘y’yellow
      ‘k’black
      ‘w’white
    • marker

      characterdescription
      '.'point marker
      ','pixel marker
      'o'circle marker
      'v'triangle_down marker
      '^'triangle_up marker
      '<'triangle_left marker
      '>'triangle_right marker
      '1'tri_down marker
      '2'tri_up marker
      '3'tri_left marker
      '4'tri_right marker
      's'square marker
      'p'pentagon marker
      '*'star marker
      'h'hexagon1 marker
      'H'hexagon2 marker
      '+'plus marker
      'x'x marker
      'D'diamond marker
      'd'thin_diamond marker
      `'‘`
      '_'hline marker
    • alpha:透明值,接受 0~1 之间的浮点数

1
2
3
4
5
6
7
8
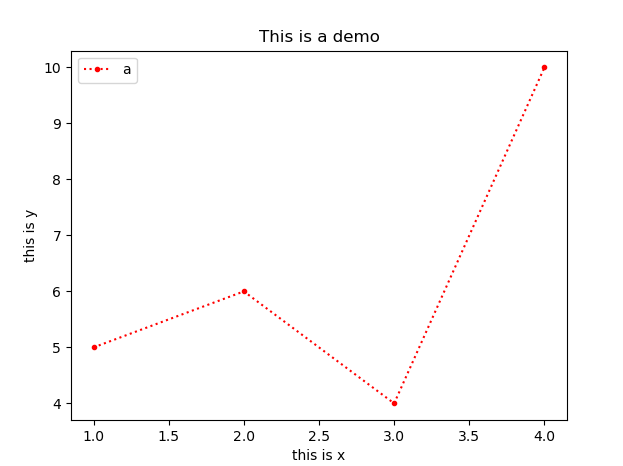
x = [1, 2, 3, 4] 
y = [5, 6, 4, 10]
plt.plot(x, y, 'r.:', label = 'a',)
plt.xlabel('this is x')
plt.ylabel('this is y')
plt.title('This is a demo')
plt.legend() 
plt.show()
image-20201221183813297

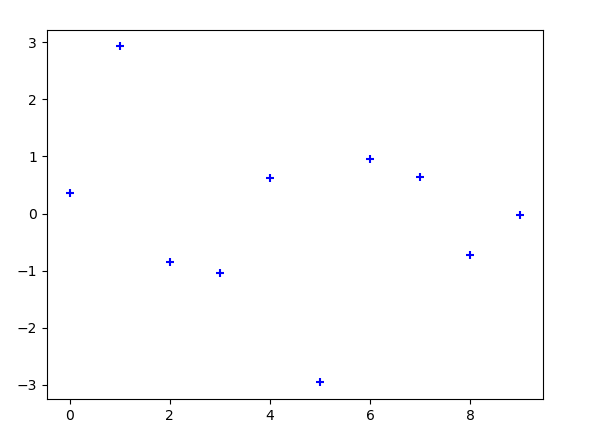
散点图

1
.scatter(x,y)
1
2
3
4
x = np.arange(10)
y = np.random.randn(10)
plt.scatter(x, y, color='red', marker='+')
plt.show()
image-20201221185252453

气泡图

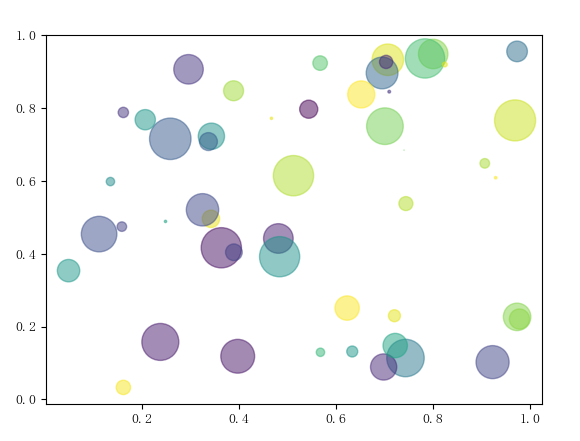
加入了第三个值 s 可以理解成普通散点,画的是二维,泡泡图体现了 Z 的大小

  • s:散点标记的大小

  • c:散点标记的颜色

  • cmap:将浮点数映射成颜色的颜色映射率

 1
 2
 3
 4
 5
 6
 7
 8
 9
10
np.random.seed(19680801)

N = 50
x = np.random.rand(N)
y = np.random.rand(N)
colors = np.random.rand(N)
area = (30 * np.random.rand(N))**2  # to 15 point radii

plt.scatter(x, y, s=area, c=colors, alpha=0.5)
plt.show()
image-20201221194637023

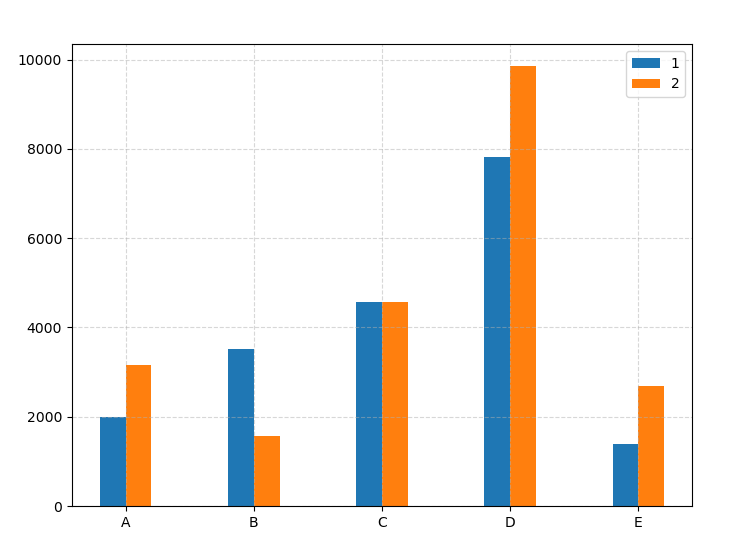
柱状图

1
2
.bar(x, y)
.barh(x, y) #横向柱状图
  • x:标示在 x 轴上的定性数据的类别

  • y:每种定性数据的类别的数量

  • align:每个柱状图的位置对齐方式

    • {'center', 'edge'}, optional, default: 'center'}
 1
 2
 3
 4
 5
 6
 7
 8
 9
10
11
12
13
14
15
16
17
18
A = ['A', 'B', 'C', 'D', 'E']
x = range(len(A))
y = [1984, 3514, 4566, 7812, 1392]
x_ = [i+0.2 for i in x]
y_ = [3154, 1571, 4566, 9858, 2689]
# 2.创建画布
plt.figure(figsize=(8,6),dpi=100)
# 3.绘制柱状图
plt.bar(x, y, width=0.2, label='1')
plt.bar(x_,y_, width=0.2, label='2')
# 显示图例
plt.legend()
# 修改x轴刻度显示
plt.xticks([i+0.1 for i in x], A)
# 添加网格显示
plt.grid(linestyle="--", alpha=0.5)
# 4.显示图像
plt.show()
image-20201221190234965
 1
 2
 3
 4
 5
 6
 7
 8
 9
10
11
12
13
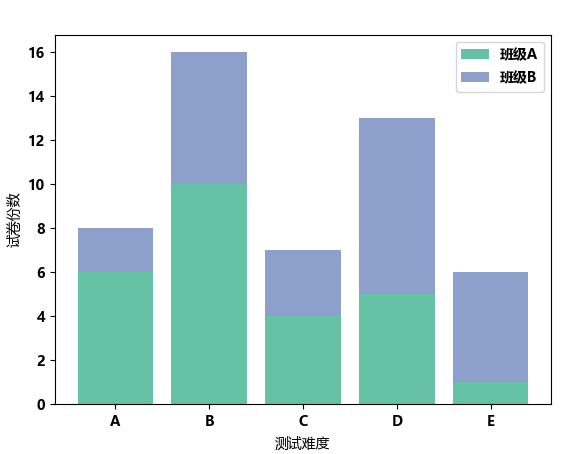
x = [1, 2, 3, 4, 5]
y = [6, 10, 4, 5, 1]
y1 = [2, 6, 3, 8, 5]

plt.bar(x, y, align="center", color="#66c2a5", tick_label=["A", "B", "C", "D", "E"], label="班级A")
plt.bar(x, y1, align="center", bottom=y, color="#8da0cb", label="班级B")

plt.xlabel("测试难度")
plt.ylabel("试卷份数")

plt.legend()

plt.show()
image-20201221195650960

直方图

直方图用于表明数据分布情况,横轴是数据,纵轴是出现的次数(也就是频数)

1
.hist(x)

x:在 x 轴上绘制箱体的定量数据输入值

重要参数

  • x : arrays(一个或多个),在 x 轴上绘制箱体的定量数据输入值

  • range : 设置显示范围(tuple or None, optional)

  • bins:x 轴的分段数,默认为 10

  • histtype : 选择展示的类型,默认为 bar

    • {‘bar’, ‘barstacked’, ‘step’, ‘stepfilled’}
  • align : 对齐方式

    • {‘left’, ‘mid’, ‘right’}
  • orientation : 直方图方向

    • {‘horizontal’, ‘vertical’}
  • log : boolean,log 刻度

  • color:颜色设置

  • label:刻度标签

 1
 2
 3
 4
 5
 6
 7
 8
 9
10
11
12
13
14
15
16
17
18
19
20
21
22
23
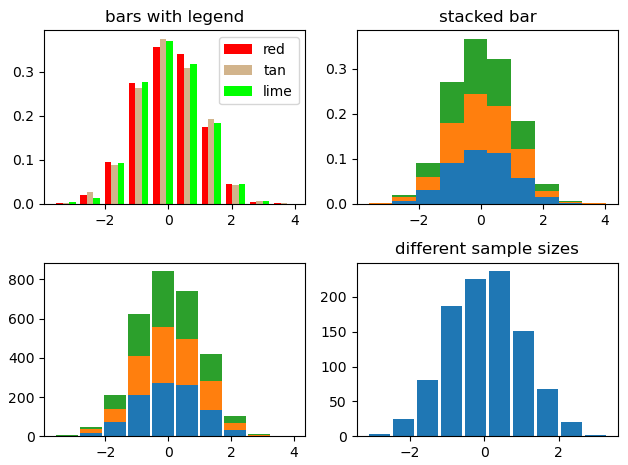
np.random.seed(19680801)

n_bins = 10
x = np.random.randn(1000, 3)

fig, axes = plt.subplots(nrows=2, ncols=2)
ax0, ax1, ax2, ax3 = axes.flatten()

colors = ['red', 'tan', 'lime']
ax0.hist(x, n_bins, density=True, histtype='bar', color=colors, label=colors)
ax0.legend(prop={'size': 10})
ax0.set_title('bars with legend')

ax1.hist(x, n_bins, density=True, histtype='barstacked')
ax1.set_title('stacked bar')

ax2.hist(x,  histtype='barstacked', rwidth=0.9)

ax3.hist(x[:, 0], rwidth=0.9)
ax3.set_title('different sample sizes')

fig.tight_layout()
plt.show()

https://trou.oss-cn-shanghai.aliyuncs.com/img/image-20201221191835717.png

饼图

饼图自动根据数据的百分比画饼

1
.pie(x)

重要参数

  • x: 定性数据的不同类别的百分比

  • explode:指定饼图某些部分的突出显示,即呈现爆炸式,传入元组,每个数据分别为 0-1 的浮点,表示分离的程度

    • 1
      2
      
      sizes = [15, 30, 45, 10]
      explode = (0, 1, 0, 0)
      
  • labels:为饼图添加标签说明,类似于图例说明

  • colors:指定饼图的填充色

  • autopct:设置百分比格式,如’%.1f%%‘为保留一位小数

  • shadow:是否添加饼图的阴影效果

  • pctdistance:设置百分比标签与圆心的距离

  • labeldistance:设置各扇形标签(图例)与圆心的距离;

  • startangle:设置饼图的初始摆放角度, 180 为水平;

  • radius:设置饼图的半径大小;

  • wedgeprops:设置饼图内外边界的属性,如边界线的粗细、颜色等, 如

  • wedgeprops = {'linewidth': 1.5, 'edgecolor':'green'}

  • textprops:设置饼图中文本的属性,如字体大小、颜色等;

  • center:指定饼图的中心点位置,默认为原点

 1
 2
 3
 4
 5
 6
 7
 8
 9
10
11
12
13
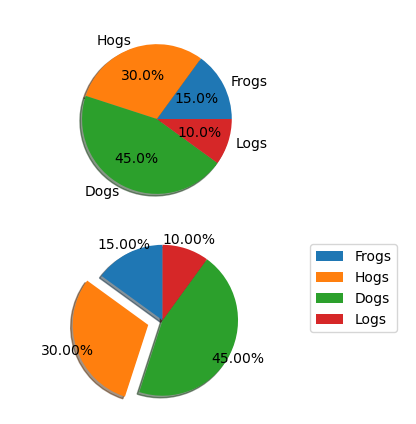
labels = 'Frogs', 'Hogs', 'Dogs', 'Logs'
sizes = [15, 30, 45, 10]
explode = (0, 0.2, 0, 0)  # only "explode" the 2nd slice (i.e. 'Hogs')

fig1, (ax1, ax2) = plt.subplots(2)
ax1.pie(sizes, labels=labels, autopct='%1.1f%%', shadow=True)
ax1.axis('equal')
ax2.pie(sizes, autopct='%1.2f%%', shadow=True, startangle=90, explode=explode,
    pctdistance=1.12)
ax2.axis('equal')
ax2.legend(labels=labels, loc='upper right')

plt.show()
image-20201221193236346

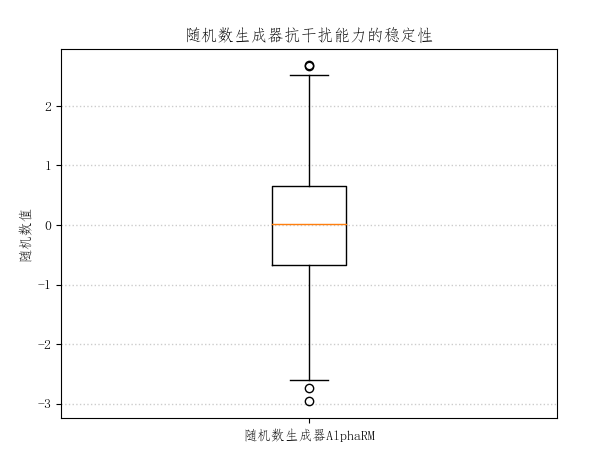
箱型图

1
.boxplot(x)
  • x:数据
  • vert:方向
 1
 2
 3
 4
 5
 6
 7
 8
 9
10
11
x = np.random.randn(1000)

plt.boxplot(x)

plt.xticks([1], ["随机数生成器AlphaRM"])
plt.ylabel("随机数值")
plt.title("随机数生成器抗干扰能力的稳定性")

plt.grid(axis="y", ls=":", lw=1, color="gray", alpha=0.4)

plt.show()
image-20201221194013577

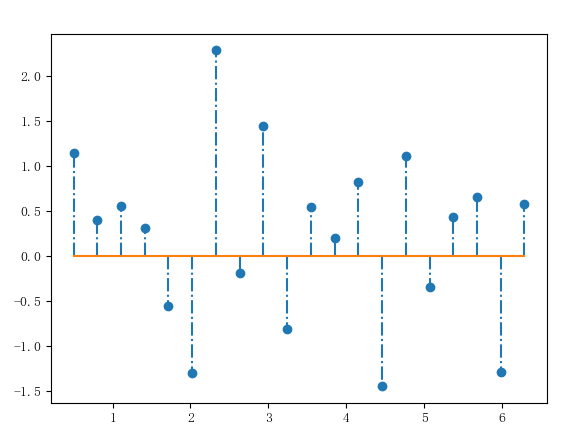
棉棒图

绘制离散有序数据

1
.stem(x, y)
  • x:制定棉棒的 x 轴基线上的位置

  • y:绘制棉棒的长度

  • linefmt:棉棒的样式

  • markerfmt*:棉棒末端的样式

  • basefmt*:指定基线的样式

1
2
3
4
5
6
7
8
9
import matplotlib.pyplot as plt
import numpy as np

a = np.linspace(0.5, 2*np.pi, 20)
b = np.random.randn(20)

plt.stem(a, b, linefmt="-.", markerfmt="o", basefmt="-")

plt.show()
image-20201221194353533

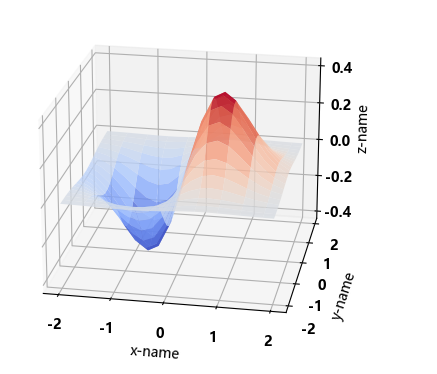
三维图

 1
 2
 3
 4
 5
 6
 7
 8
 9
10
11
12
fig = plt.figure(5)
ax=fig.add_subplot(1,1,1,projection='3d')     #绘制三维图

x,y=np.mgrid[-2:2:20j,-2:2:20j]  #获取x轴数据,y轴数据
z=x*np.exp(-x**2-y**2)   #获取z轴数据

ax.plot_surface(x,y,z,rstride=2,cstride=1,cmap=plt.cm.coolwarm,alpha=0.8)  #绘制三维图表面
ax.set_xlabel('x-name')     #x轴名称
ax.set_ylabel('y-name')     #y轴名称
ax.set_zlabel('z-name')     #z轴名称

plt.show()
image-20201221200155588

其他

保存

1
.savefig(path, dpi, facecolor, edgecolor,bbox_inches)

参数

  • path:文件路径
  • dpi:分辨率
  • facelolor,edgecolor:子图之外的图形背景颜色,默认为‘w’
  • format:文件格式
    • 'png','pdf','svg','ps',''eps'......
  • bbox_inches:要保存的图片范围,若传递'tight',会去除图片周围空白部分

解决中文乱码问题

 1
 2
 3
 4
 5
 6
 7
 8
 9
10
import matplotlib.pyplot as plt
plt.rcParams['font.sans-serif'] = ['SimHei']  # 用来正常显示中文标签
plt.rcParams['axes.unicode_minus'] = False  # 用来正常显示负号
# 或
import matplotlib as mpl
mpl.rc("font", family='MicroSoft YaHei', weight='bold')
# 或
from matplotlib.font_manager import FontProperties
myfont=FontProperties(fname=r'C:\Windows\Fonts\simhei.ttf',size=14)
sns.set(font=myfont.get_name())